In September, Macquarie University Professor of Accounting and Corporate Governance James Guthrie conducted an excellent analysis of employment figures at Victorian public universities. Facing mass redundancies across the sector (up to 40,000 jobs lost last year) and endemic casualisation, Guthrie’s point was simple: to understand the full extent of the crisis in higher education, you need transparent, accurate and consistent methods of reporting workforce data.
Inspired by Guthrie’s article, I set out to investigate NSW’s 11 public universities. After combing through Annual Reports and publicly-available data, I found major discrepancies in how NSW universities chose certain metrics and calculated employment figures, even between their own data sources. Ultimately, NSW universities underrepresented job losses in 2020, especially for casual staff.
What were the issues in Victorian public universities?
Guthrie found that there’s no real requirement for presenting employment data in universities’ Annual Reports – a key measure of accountability for major entities. If you take any five universities’ Annual Reports, some will give you pages of detailed tables, while some sneak in a number in a throwaway sentence or a “snapshot” summary.
You’ll also notice that while some universities report the “headcount”, i.e. the absolute number of staff members, some report the “full-time equivalent,” or FTE. This reduces a part-time or casual employee into the proportion of hours of a full-time employee (who represents 1 FTE). For example, a part-timer who works one day a week represents 20% of a full-time employee, or 0.2 FTE.
The issue is that FTE obscures the exact number of part-time and casual staff at a university. If a university reduces its FTE by 10, there’s no way to know if that represents 10 full-time employees, 20 part-time employees or more than 50 casuals. This has real ramifications when Vice-Chancellors, university executives and the media engage in public discourse about austerity measures, voluntary redundancy programs and underpayment of casual staff. In January, Guthrie and Tom Smith argued that universities “should report real staff numbers not accounting abstractions”; as “casual and insecure workers were the first in the university sector to go with the pandemic,” representing people as FTE makes it “easier when you want bodies to disappear.”
What are the requirements for reporting workforce data at NSW universities?
In short, there aren’t many. State governments set the reporting requirements for public universities, which are considered “statutory bodies” (they hold special status under law, and are set up by Acts of Parliament). According to the Annual Reports (Statutory Bodies) Act 1984, aside from financial statements, public universities just have to submit a “report of operations,” in their Annual Report including information about their “management and structure” and “summary review of operations.”
Because of these vague and unhelpful requirements, NSW public universities practically have carte blanche in how they calculate and present workforce data. In particular, how they calculate that elusive FTE figure, estimating the workload of thousands of casual employees, is unknown.
Thankfully, public universities submit statistics to the Australian Charities and Not-for-Profits Commission, which are publicly available on its Register. This includes the headcount of full-time, part-time and casual employees, as well as FTE and volunteers, and is generally more reliable than Annual Report data.
Universities also had to comply with Division 3, Part 3 of the Public Finance And Audit Act 1983, e.g. presenting their financial statements in a particular way and keeping proper records about their operations. This was repealed on 1 July 2021, signalling that universities may be subject to less scrutiny for reporting the true state of affairs in the future.
What were my main findings?
1. Glaring discrepancies between stats in Annual Reports and stats from the ACNC
Trawling through Annual Reports felt like wading through a corporate wasteland, with universities throwing out wildly different metrics (headcount, FTE, “continuing” vs “fixed-term”). None of the figures in a university’s Annual Report, which often excluded casuals, lined up exactly with their ACNC statistics, which included casuals. Sometimes they were inexplicably wrong (if my comparison is to be believed, Southern Cross University’s casuals constituted -7.4 FTE in 2020).
This may be because universities extract data at different times. Several Annual Reports display employee numbers as at 31 March, when universities have to finalise employment data with the Department of Education, Skills and Employment (not publicly available). By contrast, ACNC stats are for the “last pay period” before 31 December – when a great number of casuals are not on the university’s books due to the summer break. This significant caveat, as Guthrie reported, means casuals are underestimated, and leaves data prone to manipulation and misinterpretation.
Additionally, some universities report to the ACNC as part of a broader group structure, which includes affiliated entities. For example, UNSW’s corporate group includes various trusts and clinical research organisations, which have their own employees.
2. A trend of excluding casuals from Annual Reports
8 of the 11 universities’ annual reports explicitly excluded casual or sessional staff from key statistics about their workforce (and only 1 of those, Newcastle, included casuals in a separate calculation). The remaining 3 universities were unclear.
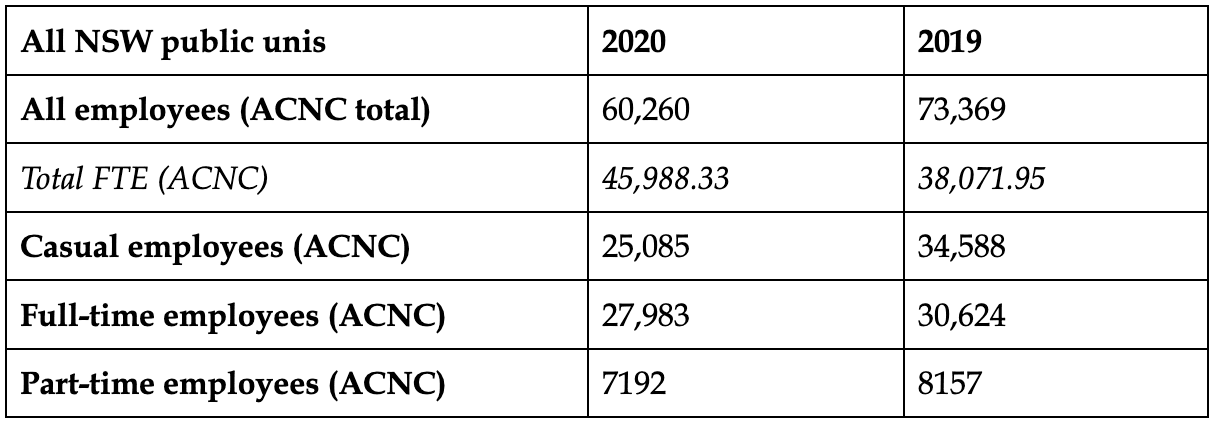
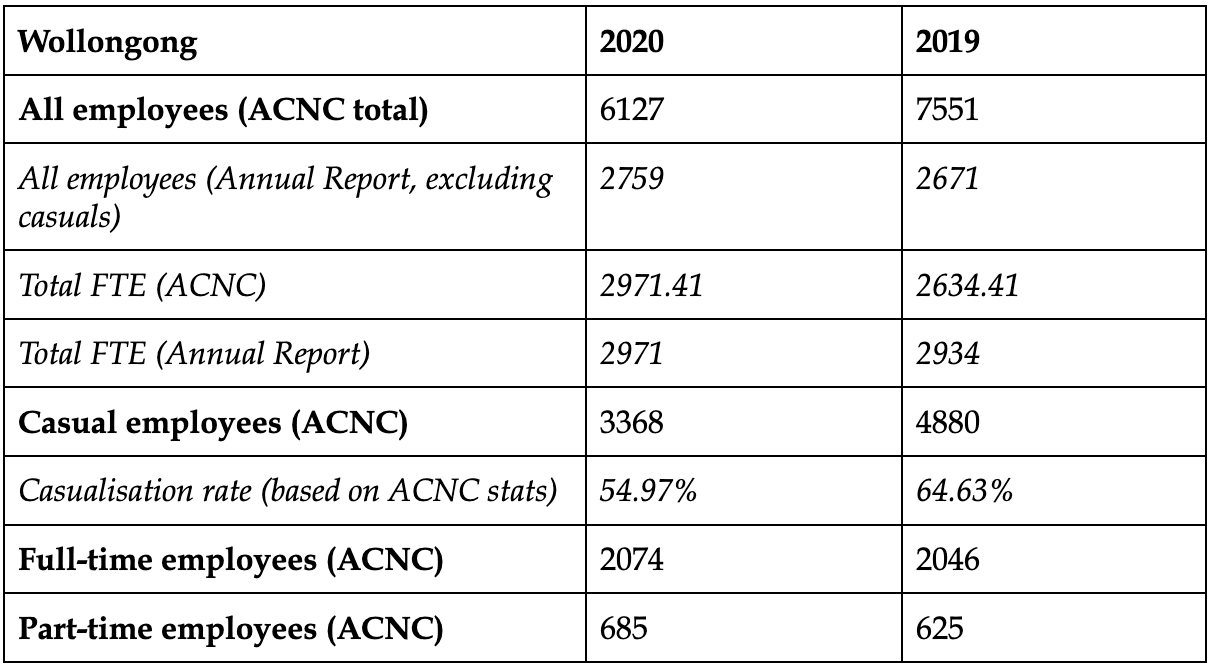
Perhaps this signals that universities are unwilling to confront the extent of casualisation in higher education. If they did, the numbers would change drastically. ACNC data shows that there were 60,260 employees at NSW public universities in 2020, compared to a completely wrong “total” of 29,093 in casual-less Annual Reports. Counting casuals would reveal that just over two-fifths of employees (41.63%) at NSW universities are casuals. It would also show, for example, a massive shedding of casuals at the University of Wollongong in 2020 (1512 of 4880 = 30.98%); and despite that, more than half of staff which remained were casuals (3368 of 6127 = 54.97%).
3. A major reduction in headcount across NSW in 2020
The ACNC statistics are alarming: in 2020, the workforce in NSW public universities shrunk by over 13,000 (from 73,369 to 60,260). It provides more evidence that universities bore the brunt of the pandemic, and in turn introduced rash and punishing austerity measures to misguidedly cover up a lack of government support. Most of this leakage came from 10,000 casual staff losing their jobs.
The total headcount in 2020 Annual Reports, while incomplete (as not all universities reported it), is actually slightly higher than 2019; probably because they were reported as at March 2020, when lockdowns were be a temporary novelty and austerity was not in full force.
4. Confusion around the make-up of their workforce
Despite the ACNC requiring this data, no NSW university broke down their workforce by full-time, part-time and casual employees in their Annual Reports, which would have helped illuminate broader trends in employment. This meant I couldn’t compare both headcount and FTE for NSW universities like Guthrie did for Victoria. Universities often preferred reporting the split between academic and professional/general staff, and slightly preferred reporting FTE over headcount.
5. Potential recalculations across years
In a later article, Guthrie discovered that some Victorian universities were actually “recalculating” their employment figures from year-to-year, by uploading updated versions of old Annual Reports without disclosing this to the public. While all the figures I saw were consistent between years, I may have been an unwitting victim.
Ultimately, transparency in reporting employment figures allows us, as observers, to properly assess the impact of government underfunding, redundancies and job losses on NSW universities, and ensures that they can’t cover up their tracks. Even though it might be uncomfortable for universities, the truth is this: the numbers don’t lie.
What were some of the numbers for each university?
USyd
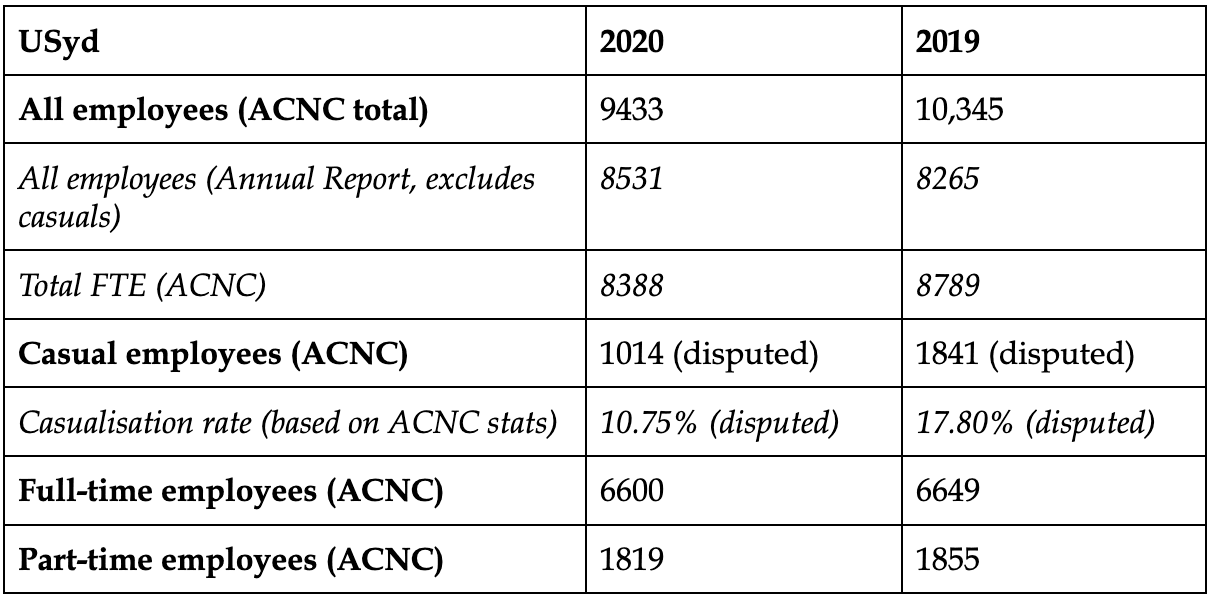
USyd excluded casual staff from its annual reports. And in its ACNC statistics, USyd claims that casuals made up over 10% of its workforce in 2020, and almost 18% in 2019. However, this is a gross underestimation, due to the ACNC’s reporting period excluding several casuals as outlined above. Data from the Workplace Gender Equality Agency, which is reported as at 31 March, corrects this to 47.5% in 2020 and 46.2% in 2019.
USyd’s Annual Report says that its workforce expanded in 2020, while its ACNC total decreased by almost 1000. For reasons outlined above, neither are completely accurate. The Annual Report split employees down academic/professional and continuing/fixed-term distinctions, which did not correlate with any combination of full-time/part-time/casual employees, again displaying the perplexing nature of these reports.
UNSW
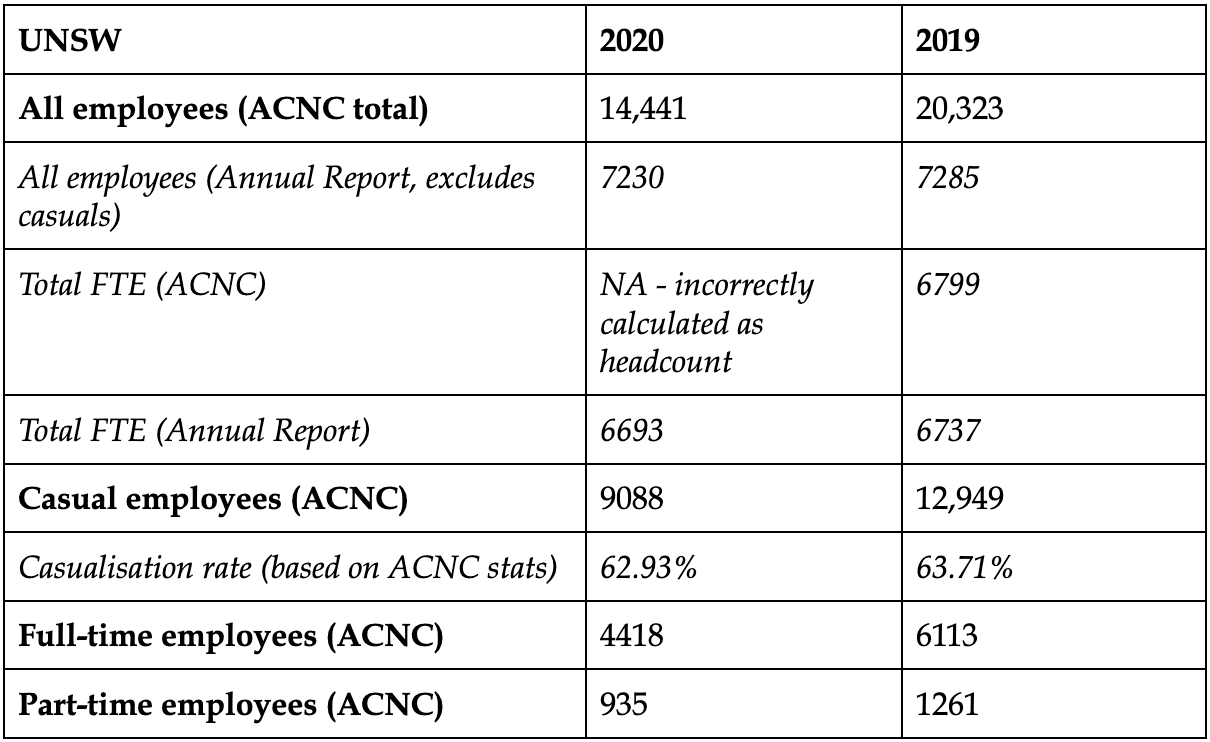
UNSW’s 2020 Annual Report included almost 2000 full-time and part-time employees that were unaccounted for in its ACNC statistics. The Annual Report also massively failed to include almost 13,000 casual staff in 2019 (9000 in 2020), meaning that UNSW’s casualisation rate hovers at around 63%, conservatively estimated. Overall, despite what Annual Reports say, UNSW’s ACNC statistics show that over a quarter of UNSW employees lost their jobs in 2020 (20,323 to 14,441).
UTS
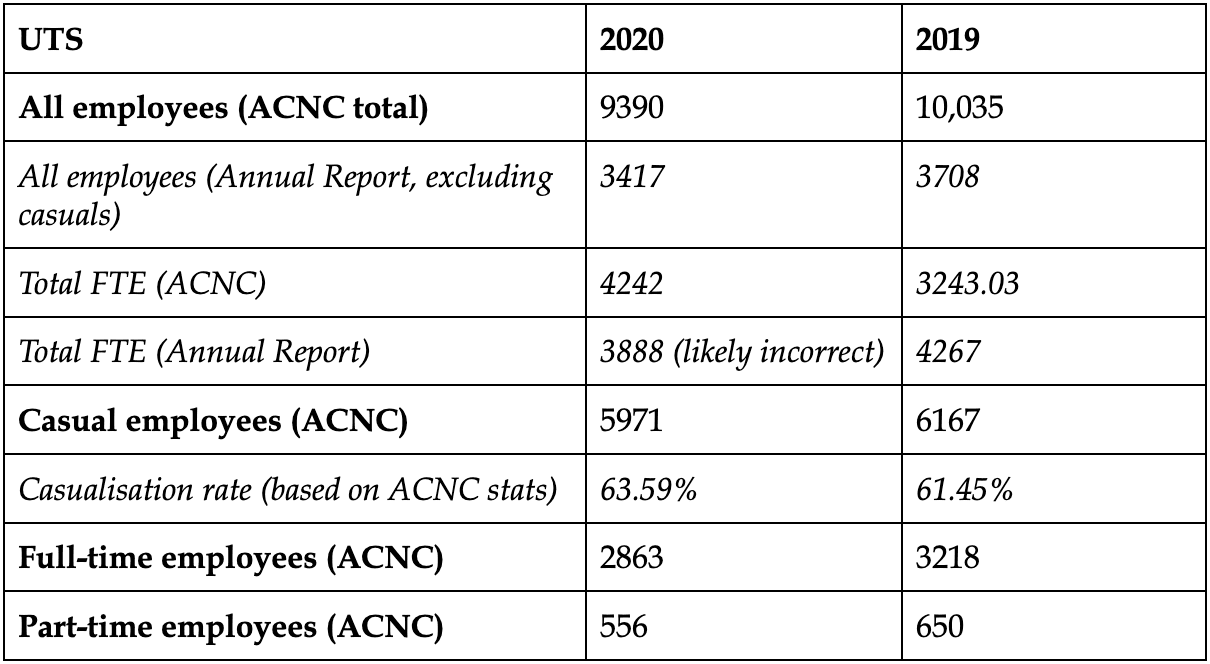
UTS’ Annual Reports for 2019 and 2020 provided academic/professional headcount and FTE, but also exhibited discrepancies with its ACNC statistics. Their FTE calculations were completely off – it had 3888 FTE and 3417 headcount (excluding casuals) in 2020, implying that each full-time or part-time employee completed more than one full-time employee’s workload.
On Page 1, they also confusingly frame FTE (which, for some reason here, does include casuals) as “persons”, which is incorrect. Like UNSW, UTS’ casualisation rate hovers around 61-63%.
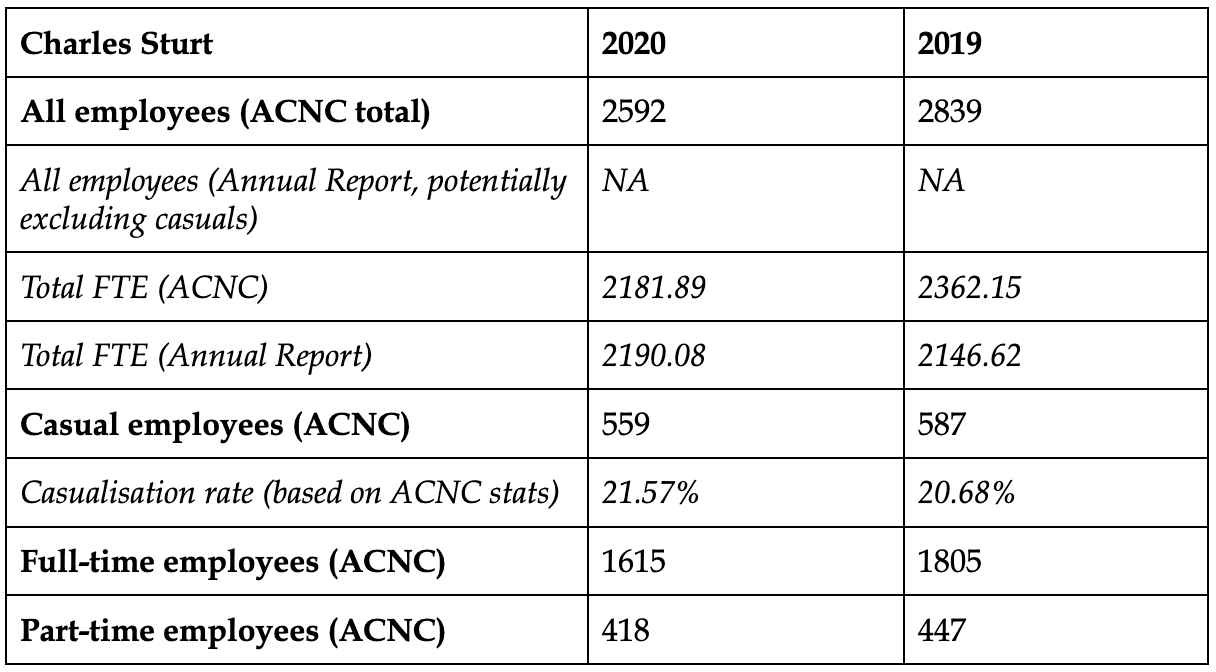
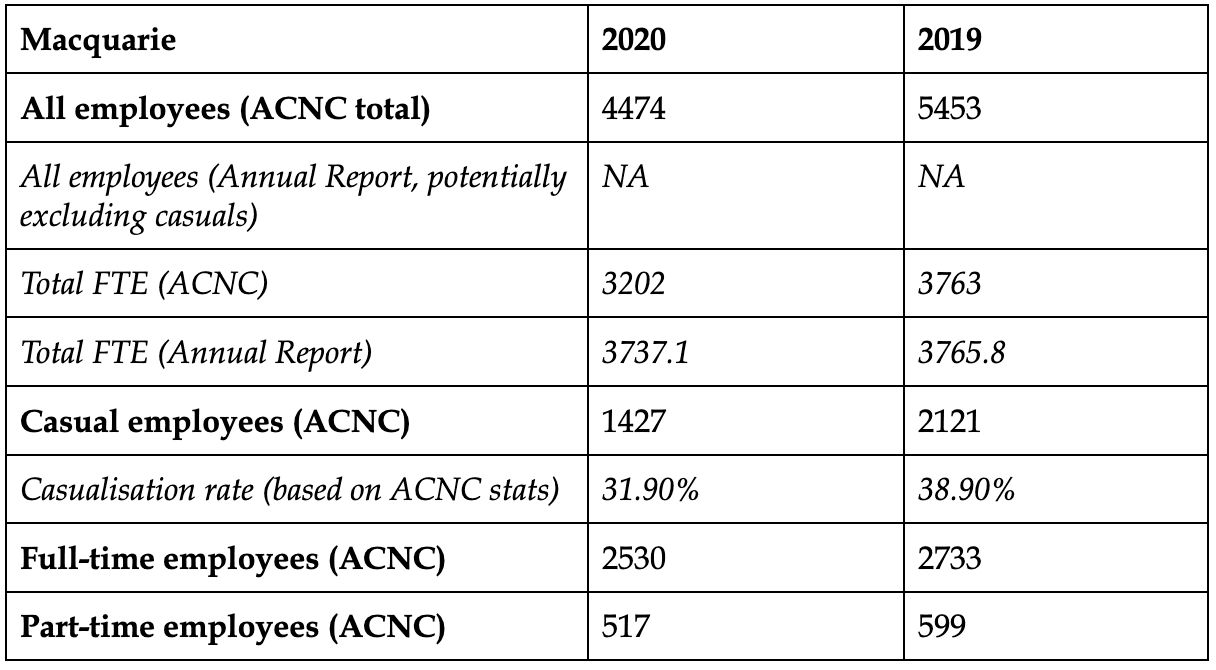
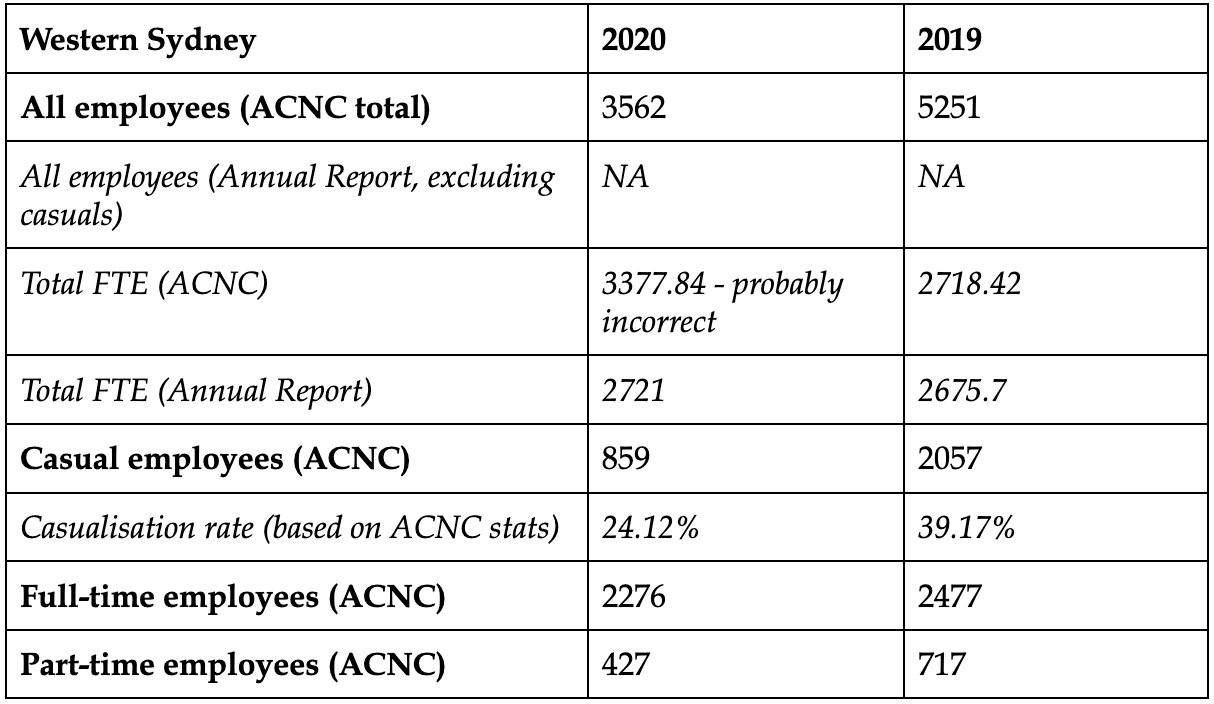
Charles Sturt, Macquarie, Southern Cross, Western Sydney
Unhelpfully, these four universities did not give us any indication of their headcount in their Annual Reports, instead choosing to report their staff data in terms of FTE. For a key report to not have this simple measure of accountability or transparency – how many people work at your university? – is alarming. Even then, none of the FTE figures in Annual Reports matched the ACNC statistics. Some were plainly inexplicable – Western Sydney recorded almost a major increase in FTE in 2020, while it recorded a major drop in headcount.
The bigger universities saw major decreases in staff numbers from 2019 to 2020. Macquarie lost almost 1000 staff out of 5000+ (distributed across full-time, part-time and casual staff, with 700 casuals lost), while Western Sydney lost almost 1700 staff out of 5000+ (again distributed across work types, with 1200 casuals – more than half of the casual workforce – lost).

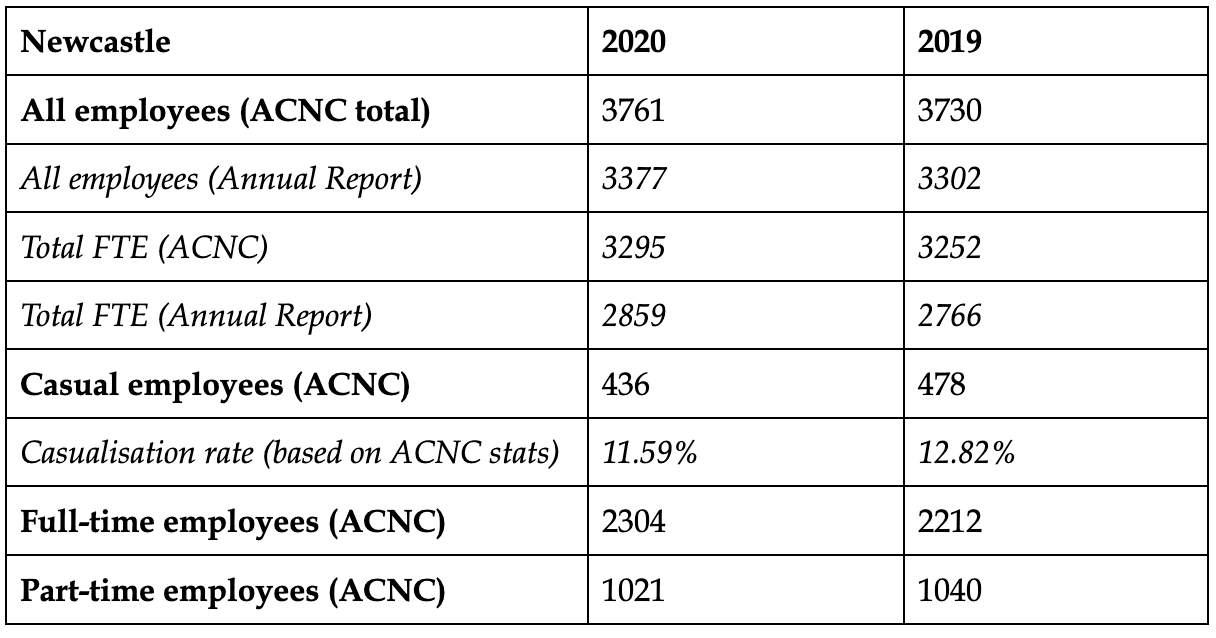
Newcastle, Wollongong, ACU, New England
Newcastle’s Annual Reports give readers a comprehensive, if sometimes confusing, breakdown of staff by academic/professional and continuing/fixed-term distinctions. They also say that casual staff represented 436 FTE in 2020 and 478 FTE in 2019, and in doing so, they confused casual headcount (to the ACNC) with FTE. Its workforce held relatively consistent from 2019 to 2020.
Wollongong saw a massive shedding of casual staff from 2019 to 2020 – three out of every ten casual staff members lost their jobs. Their Annual Report figure for total employees is almost half that of ACNC statistics (2759 vs 6127), probably because they excluded casuals from their Annual Reports.
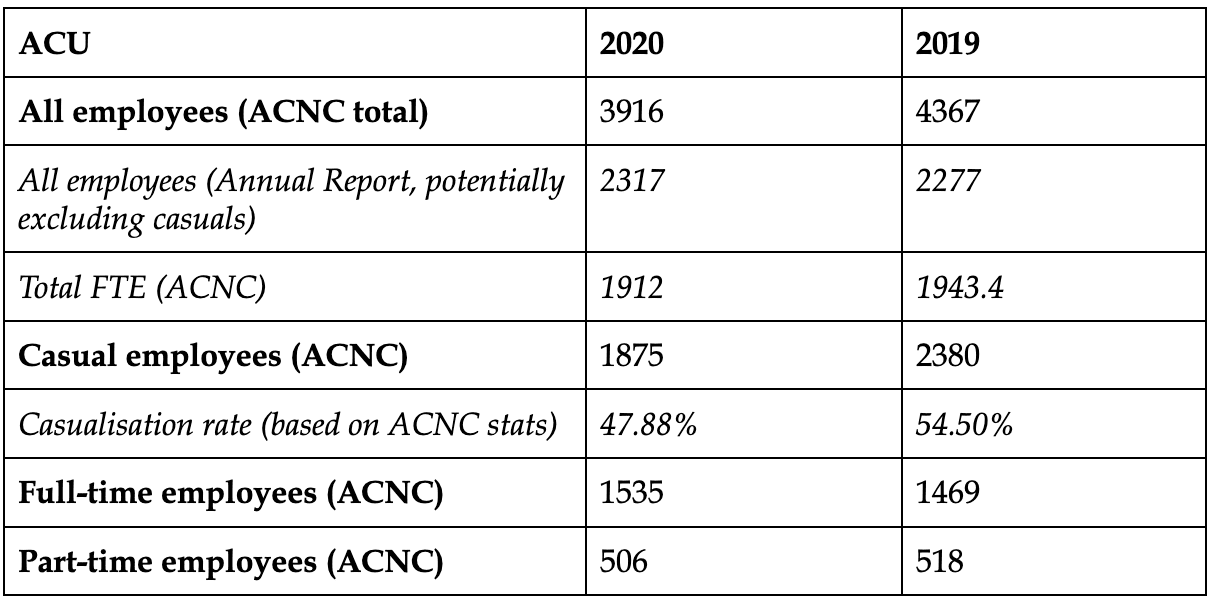
While three of its campuses are in NSW (North Sydney, Strathfield and Blacktown), the Australian Catholic University has eight campuses spread across Australia, so its reporting requirements are a bit different. ACU’s 2020 Annual Report said that ACU had 1111 academic and 1260 professional staff, for a total of 2371 staff across its campuses. This is almost 1500 less than the number they submitted to the ACNC (3916). Half of its staff in 2020 (47.88%) and in 2019 (54.50%) were casuals.
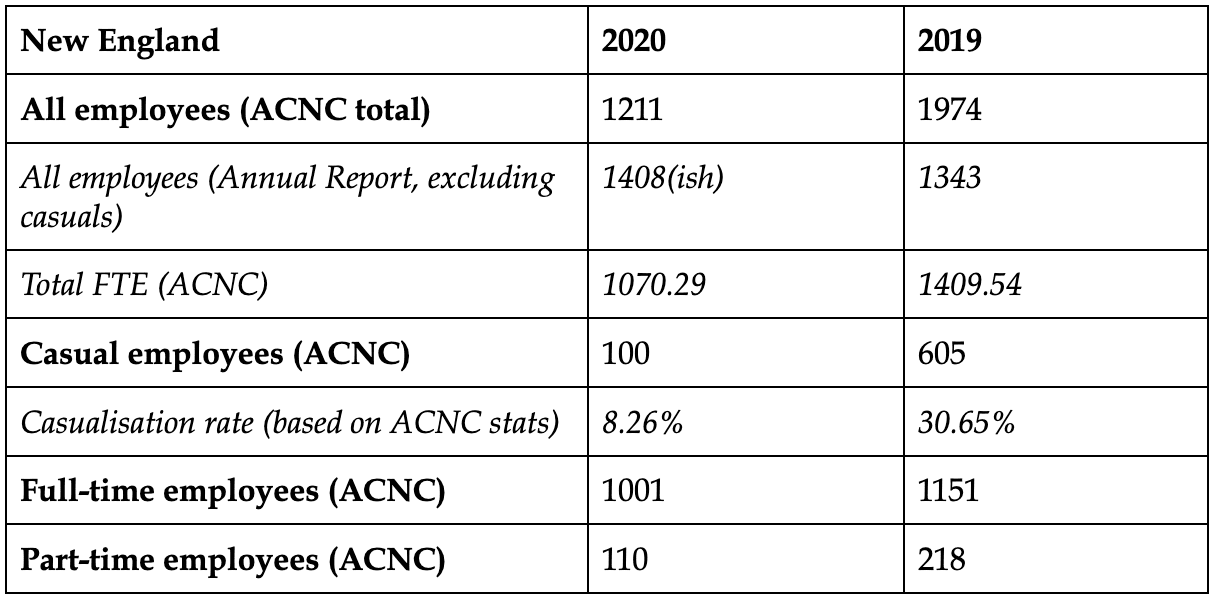
New England’s relatively small workforce saw a massive reduction in casual staff in 2020 (from 605 to a miniscule 100) – perhaps a product of consolidating its existing focus on remote and distance learning. There was also confusion within their Annual Reports about the exact number of total employees, with some numbers counting staff in controlled entities, or just simply miscalculating.
Note: this print article of this edition included Deaundre Espejo and Max Shanahan’s ‘How to corporatise a university in three steps’ which can be read here.