Geographic Information Systems (GIS) allow us to identify and represent geographical patterns about the world around us in data. In the maps presented here, I mapped out the number of disaster declarations and socio-economic deciles of each Local Government Area (LGA) in New South Wales.
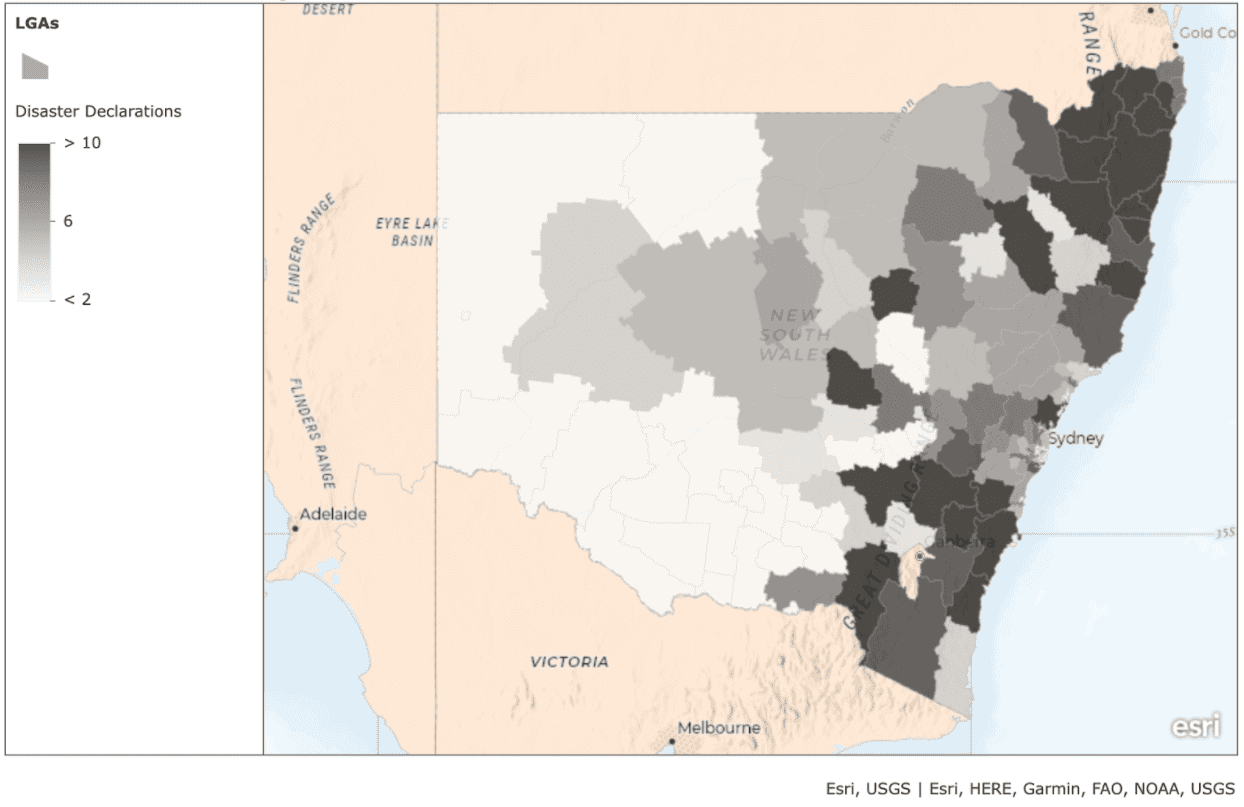
A disaster declaration, published by the NSW Government, lists the LGAs which were affected by natural disasters like floods, fire and storms. I compiled the number of disaster declarations for each LGA between the beginning of 2019 and the present. As you can see, disasters were concentrated on the North and South Coasts of NSW, with both areas affected by a number of flooding and storm events and the Black Summer bushfires. The worst-affected LGA in NSW was Eurobodalla on the South Coast, closely followed by LGAs including Shoalhaven, Bellingen and Glen Innes.
It is important to note that there are limitations to using disaster declarations to represent the effects of disasters on LGAs. The most obvious issue that I noticed was that disaster declarations do not distinguish the scale and severity of different disasters. The Black Summer bushfires only counted as one declaration: they are considered as a single event despite having, in some cases, raged for several months. This means that experiencing several destructive, but not catastrophic, storms would be disproportionately represented compared to an apocalyptic bushfire.
Additionally, the presence of disastrous conditions in an area does not necessarily tell us very much about how many people are severely affected. In densely populated areas, natural hazards can have vastly different effects to their impacts on rural areas. Perhaps one way to deal with these issues would be to model disaster impacts on insurance costs or residences destroyed, as these more closely represent the nature of the destruction caused.
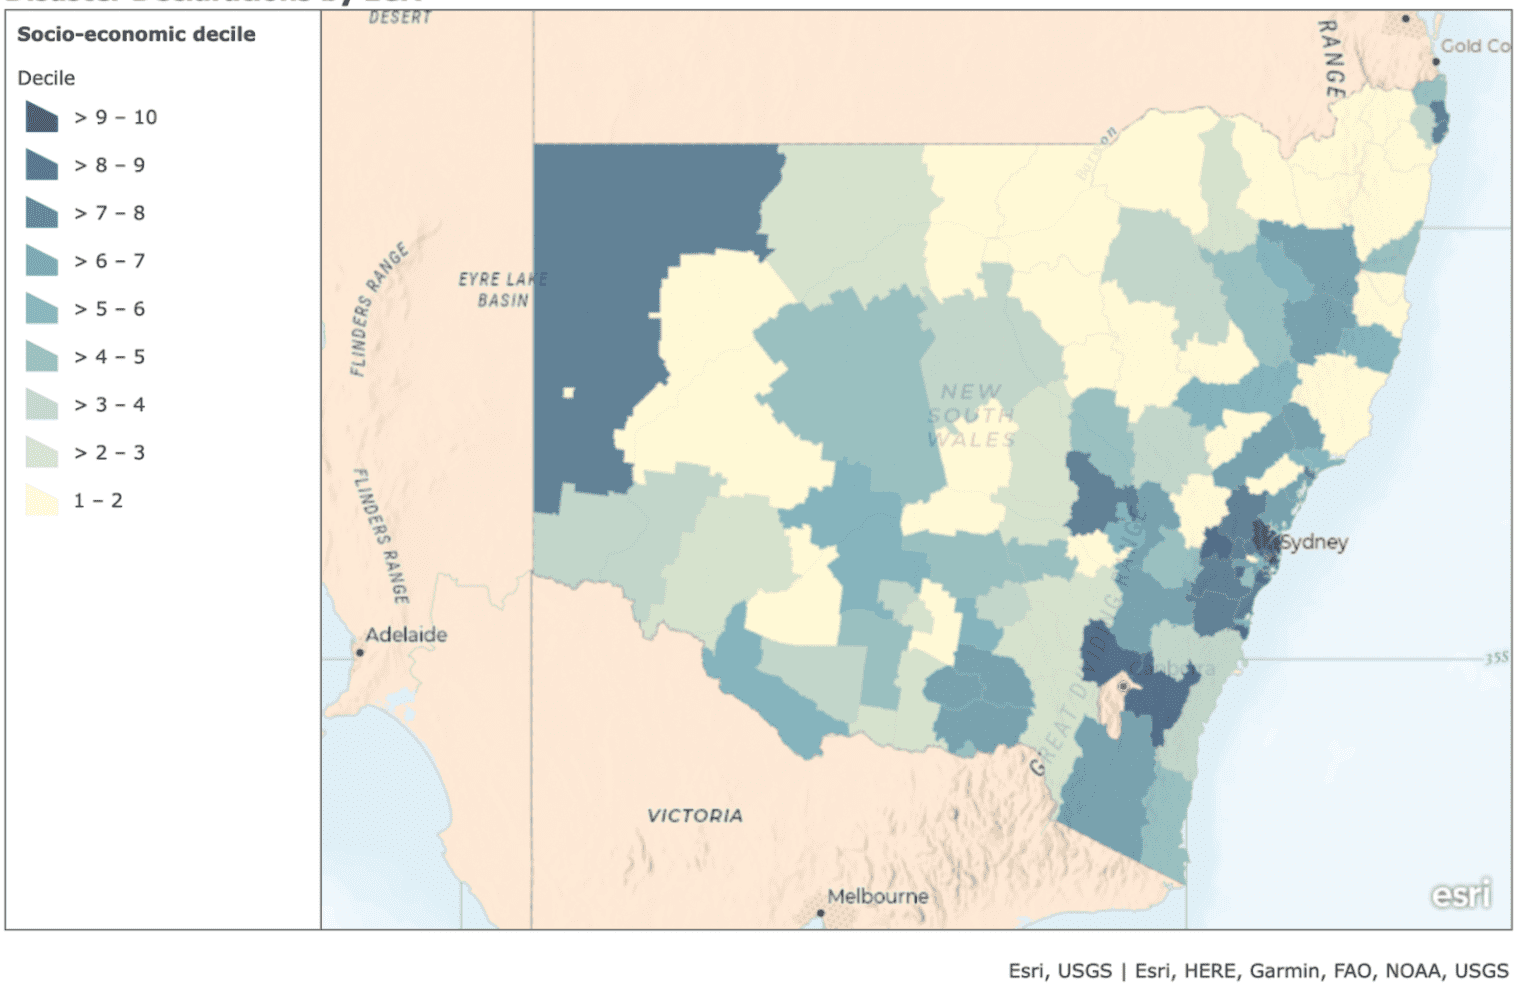
After mapping out the differences in disaster declarations, I turned to representing the relative socio-economic status of each area. Here, I used the ABS’ Index of Relative Socio-Economic Advantage and Disadvantage (IRSAD) as per the 2011 census. Poorer areas are represented as being lower on the decile scale.
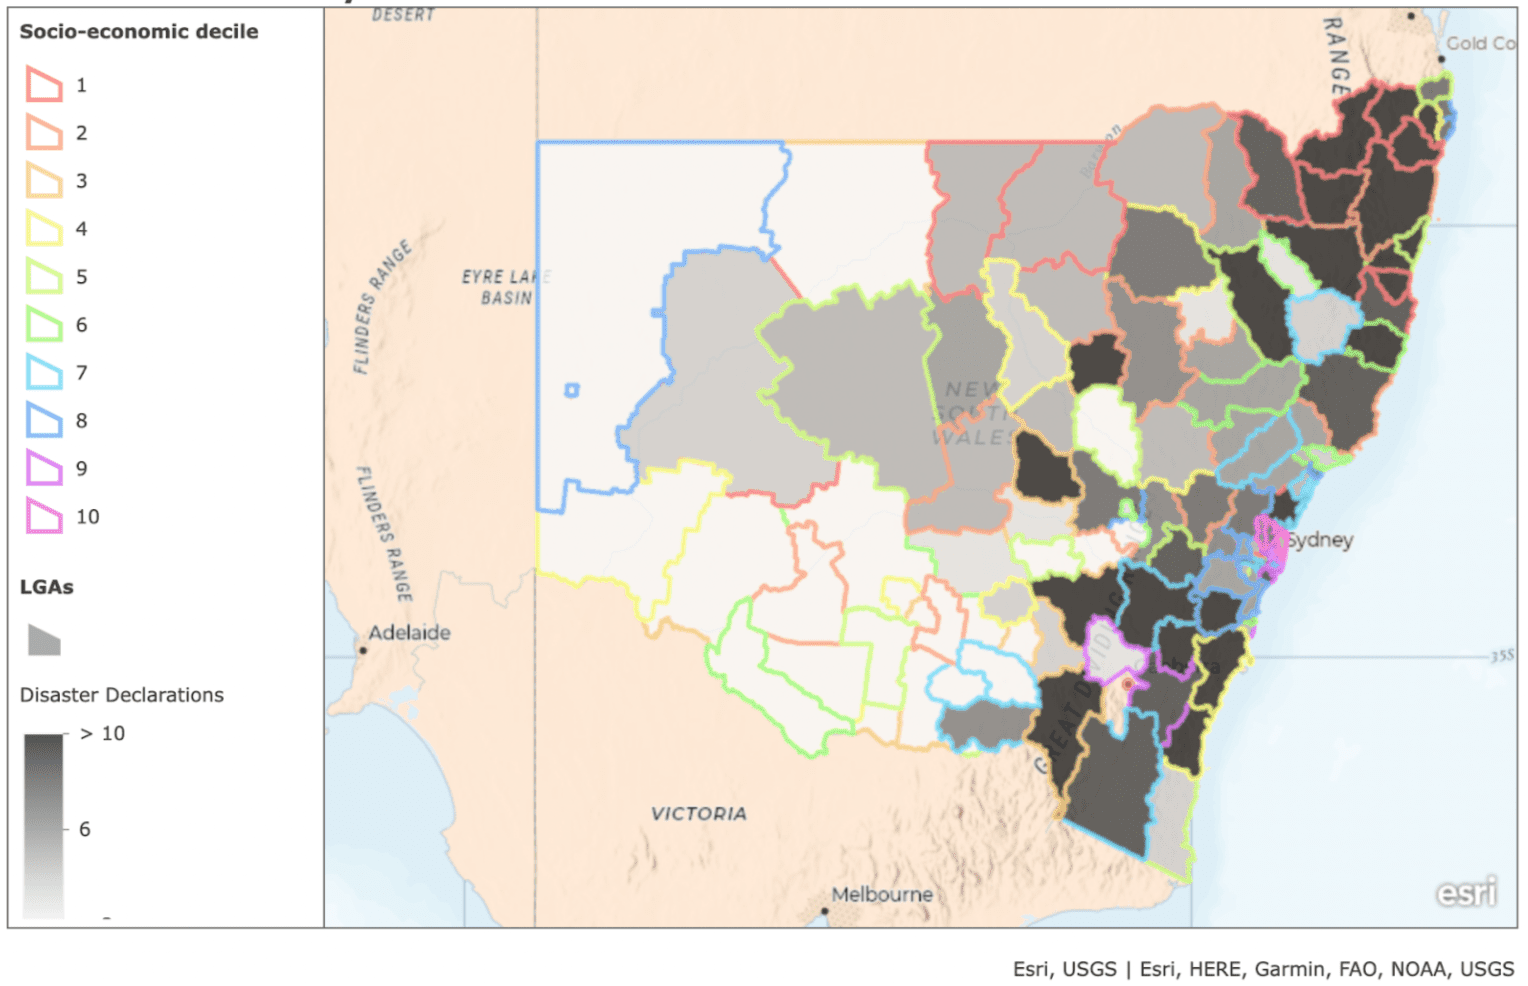
I was interested to see if there was an interplay between wealth and experiences of disaster in NSW. The most obvious connection is that the North Coast LGAs which were hardest hit by disasters were also some of the poorer in NSW. Tenterfield, Kyogle, Richmond Valley and Nambucca all were in the lowest decile and each experienced ten or more disaster declarations over the time period. Glen Innes and Clarence Valley, along with Gilgandra and Parkes in the Central West, were in the second lowest decile, also experiencing ten or more declarations. Looking south, the Shoalhaven, Eurobodalla, Snowy Valleys and Hilltops LGAs all received more than ten declarations and have below-median levels of advantage.
There were relatively few wealthier LGAs which experienced large numbers of disasters. A key reason for this is that almost all the wealthiest LGAs in NSW are within the Sydney region which also had fewer disasters than the rest of the state. In fact, perhaps unexpectedly, the only LGA in the Sydney region to fall within the bottom four deciles was Fairfield.
Part of this may be the use of the IRSAD: along with wealth, it takes into account levels of educational attainment and high mortgages or rent as indicators of advantage, which could structurally represent people living in cities as being advantaged. As such, rural areas with cheaper property and less skilled employment unsurprisingly make up the bulk of the lower IRSAD deciles.
Sydney and its surrounds are urban areas with a large stake in careful management of natural hazards and less natural areas, which may explain why urban LGAs appeared to experience fewer disasters. Nonetheless, as we have seen in the recent floods, even wealthier Sydney suburbs can experience catastrophic effects when saturated with weeks of rain bombs! The larger population of Sydney suburbs, as well as issues like housing insecurity and more complex transport systems, could mean that Sydneysiders (and those of us in Wollongong and the Central Coast too) face geographically distinct challenges during times of disaster.
Of course, there were a number of low-SES LGAs that did not experience many disasters in the time period, including Brewarrina, Walgett and Central Darling. This may be partly because the disaster declaration metric does not display the unique environmental challenges these areas have faced in recent years, like protracted drought and water shortages.
In any case, what we can draw from this data is that there are, unmistakably, several areas on the North and South Coast of NSW which have been battered by several years of successive disasters and where households are relatively disadvantaged. This illustrates the importance of climate policy which is sensitive to the uneven distribution of natural disasters.
Households facing issues like unemployment, overcrowding and debt are more likely to have trouble responding to and bouncing back from disasters. Concerningly, this is likely, because disaster-prone areas are often poorer. As natural hazards become more frequent and intense due to climate change, recovering from disasters will remain an issue of inequality.
Looking to the families on the Far South Coast still struggling with homelessness years out from Black Summer, it is obvious that disasters can be a deeply destabilising event in the long-term.
However, they don’t have to be. Demands for the Government to provide housing, as well as better response systems and financial support for survivors of disasters, aren’t just disaster mitigation; they’re anti-poverty measures.